End-user's guide
1. EasyQuery: What’s That?
The majority of software products or web applications work with databases in some way. Usually, every such program (or application) contains an option of data search and/or filtering.
It is always good when there are just a few search parameters, and when one can perform a query with a single text line (for example, Google search). Nevertheless, in most cases, you need to conduct a search while operating several parameters at the same time. For example, “Find all orders for product A made by USA companies, which have been both paid for and shipped by the beginning of the current month.” To specify indicate the conditions of such a query, you will need more than one text line.
In such cases, EasyQuery would be much of help. It is a universal query builder UI for data search and filtering. It will allow you setting the search conditions of almost any difficulty while using exclusively natural language, terms, and expressions of which are familiar to user.
2. EasyQuery Components.
The EasyQuery user interface consists of three main components – an Entities Panel, Conditions Panel, and Columns Panel. Data will be displayed in the Results Panel. The picture below can help you understand which is what.
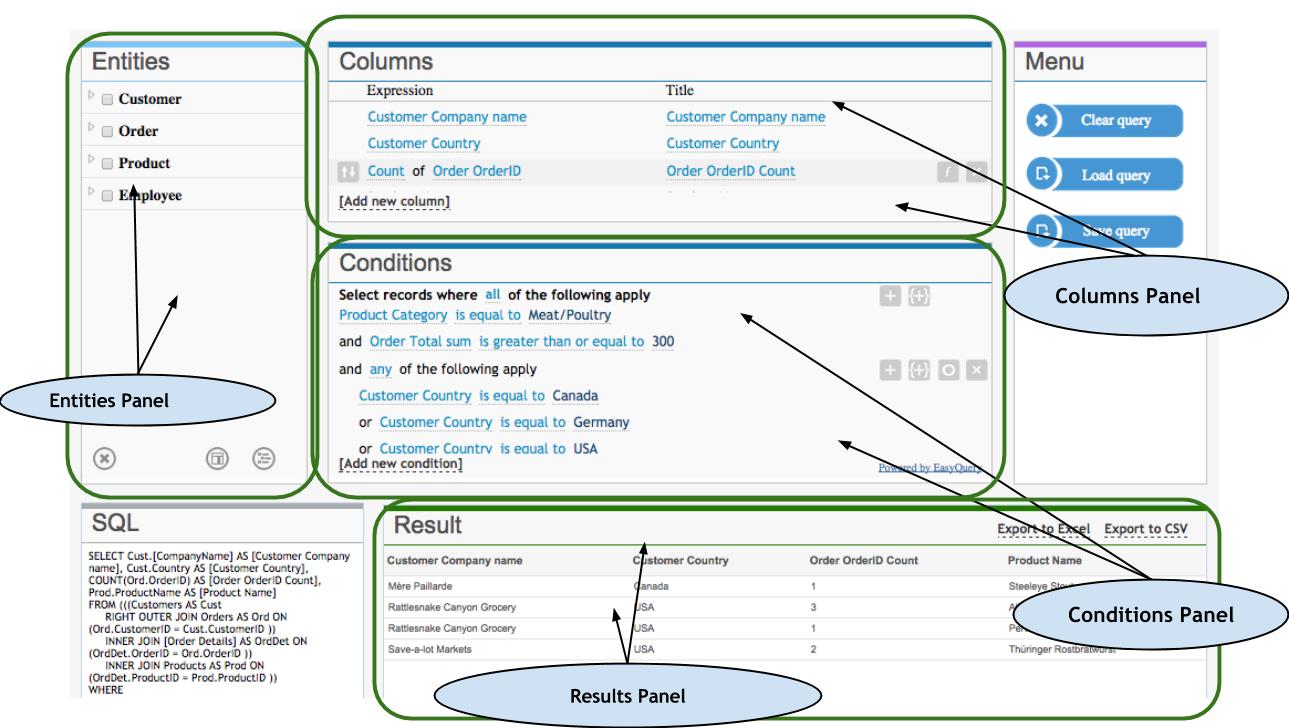
NB: SQL Panel is not a component of the EasyQuery UI. It is displayed here exclusively to demonstrate what a particular query would look like in SQL (Structured Query Language). You will not normally see this panel in most applications which use EasyQuery.
Each component can be used separately. For example, it’s possible to use only Conditions Panel for data filtration while the columns are defined internally inside application.
About entities and attributes
While working with EasyQuery, a user operates entities and their attributes. They constitute something like a structure of data that one can extract through construction of queries.
Entity is some real-world object, information on which is stored in the database. Examples of entities are as follows: ‘Customer,’ ‘Order,’ ‘Product,’ etc. Every entity has an initial set of attributes or parameters. Thus, attributes for such entity as ‘Customer’ can be: Name, Address, Country, and others.
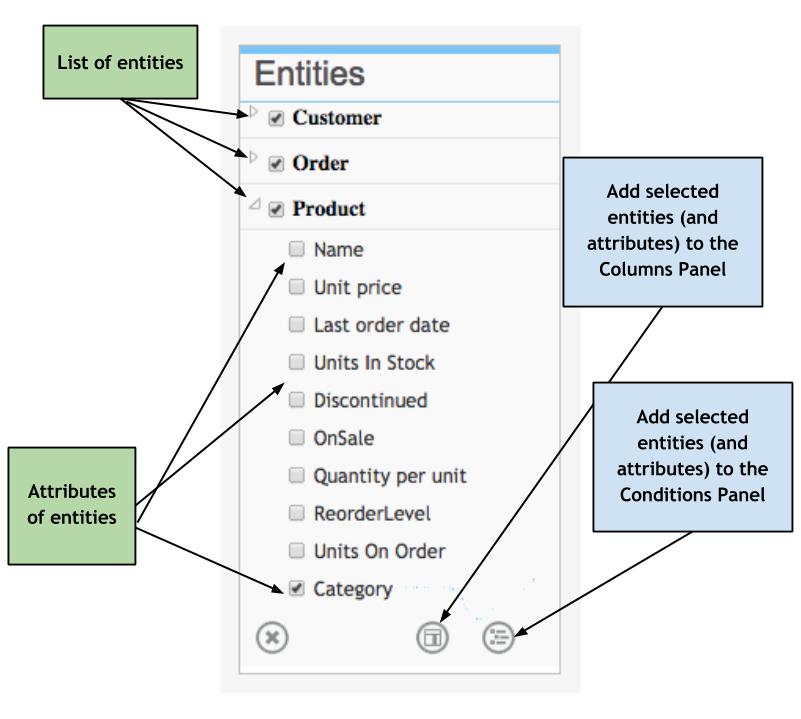
Entities Panel
This panel can be used as a visual representation of all entities and their attributes, which we can use to build queries. It can be used to add entity attributes to a Columns Panel (and they will be displayed in the result) or to a Conditions Panel (in order to actually set the query conditions).
You can either move selected attributes to the corresponding panels with a mouse or use buttons Add column and Add condition ( 
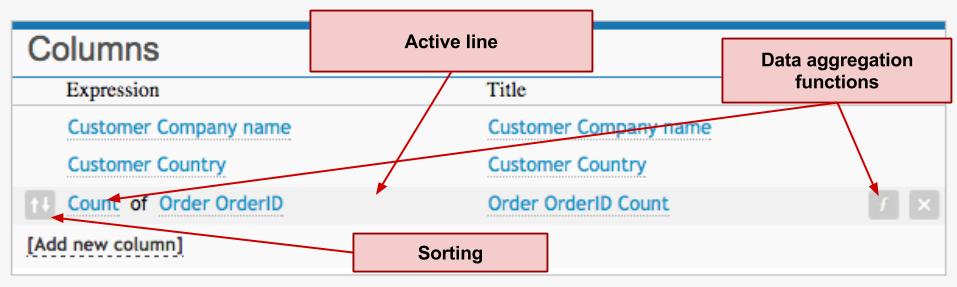
Columns Panel
Using columns panel you can specify the columns which you want to be displayed in your query results.
You have a list of lines, each of them represents a column in the query results (in the Results Panel). Every line consists of Expression, which is an attribute, a Title, which serves as a column title in the Results Panel, and buttons – for sorting (on the left), aggregating and deleting (on the right).
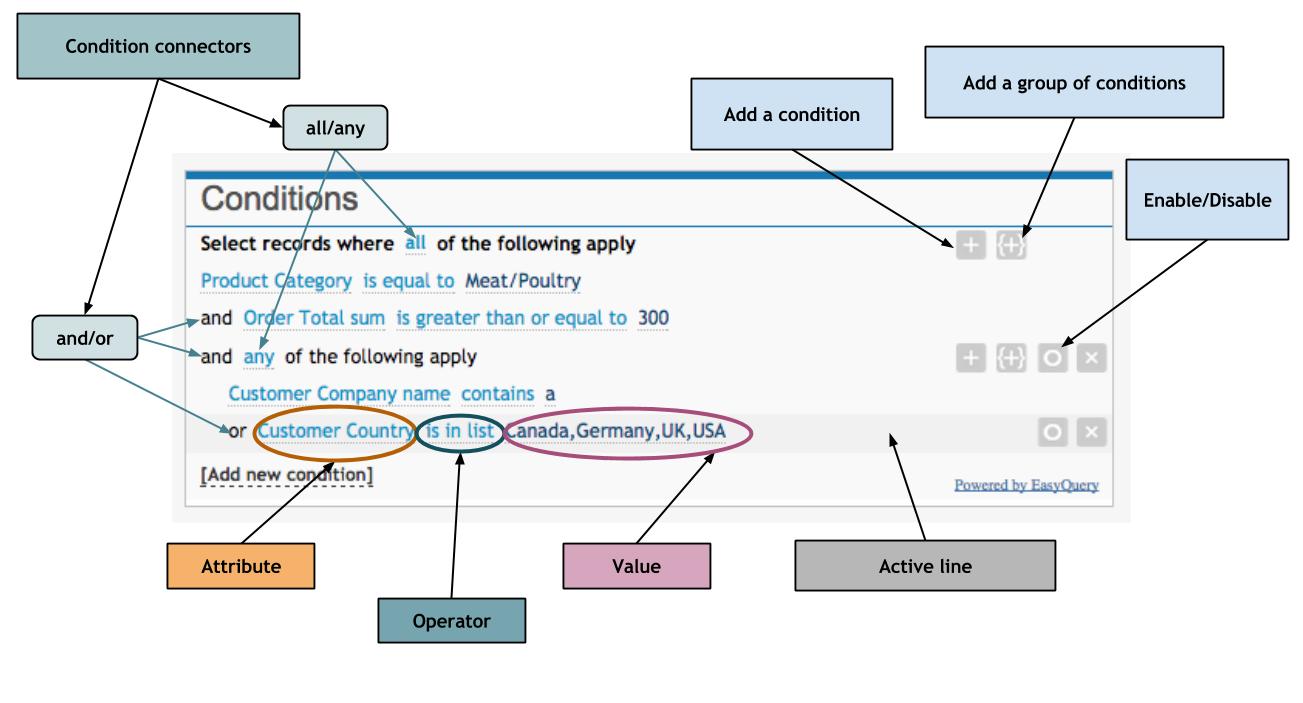
Conditions Panel
Here you can specify filtering conditions for data selection. So the result of your query will include only the data that satisfy those conditions.
Every line in the Conditions Panel corresponds to a single query condition. Every condition consists of 3 elements – an expression (some entity attribute), an operator, and value(s) (one or more).
We have mentioned attributes above (e.g., ‘Company Name,’ ‘Product Price,’ and ‘Order Date’). Together with values, operators set certain limitations regarding data which is stored in a given attribute. For example, “(Date) is equal to 23 Jul 2014,” “(Quantity) is greater than 35,” “(Price) is less than 1,000,” and “(Name) starts with A.”
Basic queries: hot to make them with EasyQuery
1) Display Table Data
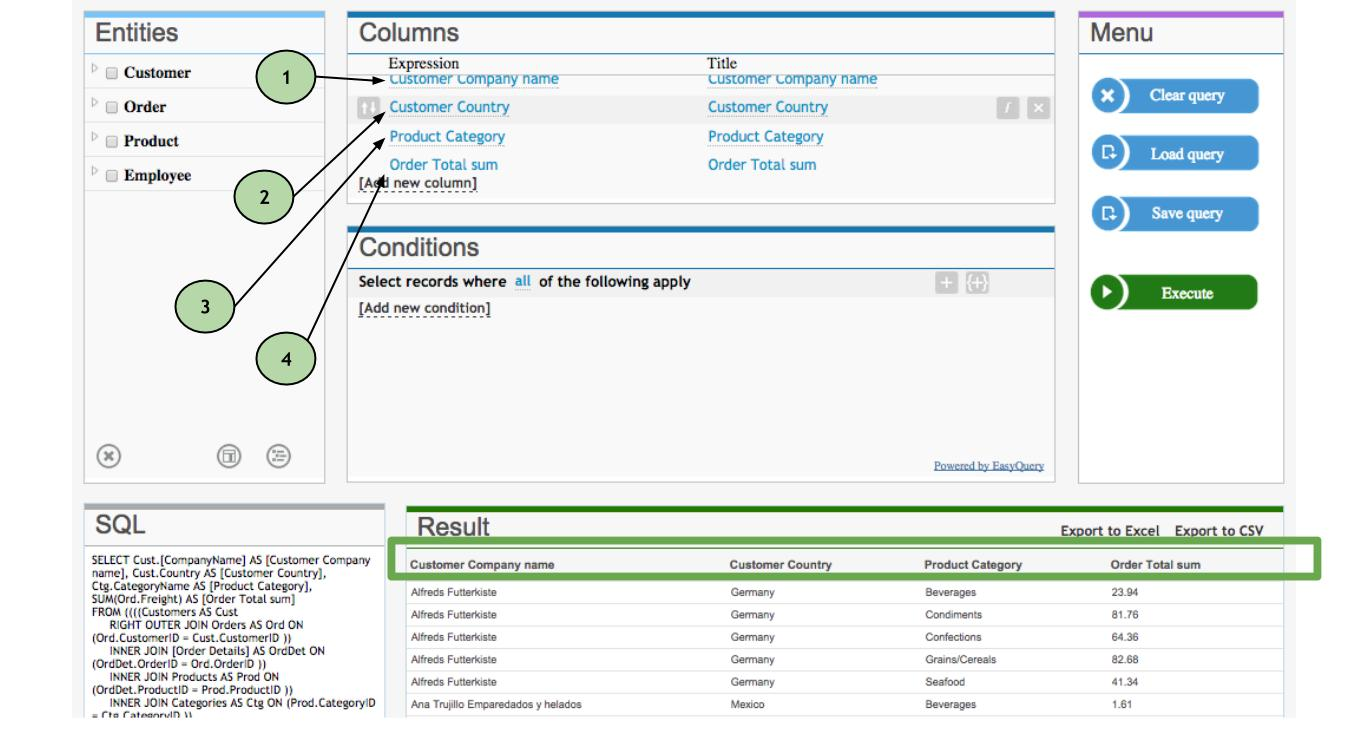
Let us imagine that we need a table, which contains following data: names of our customer companies along with countries of their origin, names of categories in which they ordered products, and a total sum of orders each of them made.
So, we select following entities and their attributes to add them in the Columns Panel:
- Customer -> Company Name
- Customer -> Country
- Product -> Category
- Order -> Total Sum
Clicking on the Execute button displays our query result just as we need it.
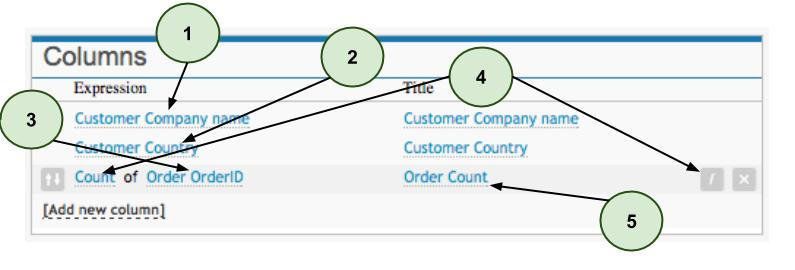
2) Table Data with Aggregated Columns
EasyQuery allows to aggregate data for each column in the query result. For example, we may need a total quantity (amount) of the orders for every company.
We are going to add the following columns:
- Customer -> Company Name
- Customer -> Country
- Order -> Order ID (we need an attribute of the Order entity to calculate the amount of orders)
- Click on the button and select the "Count" function
- Change the title for last column to "Order Count" - just to represent its purpose.
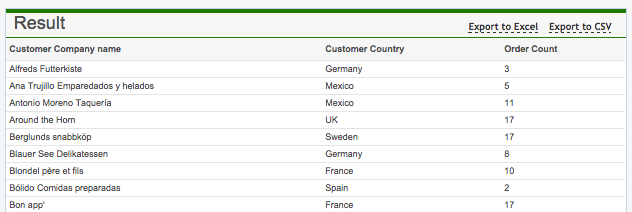
3) Table Data with Sorting
Let us use the previous example, in which, as a result, we get columns with data on:
- names of customer companies,
- countries of their origin,
- amount of products they paid for.
First steps are the same as in the previous example:
- Customer -> Company Name
- Customer -> Country
- Order -> Order ID
- We make the last line active and select Count after clicking on the Function button
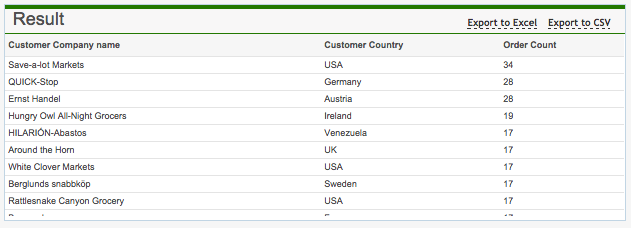
This time, let us sort data by the number of orders, in the descending order. To do this, we
- make the line Count of Order ID active, click on the sorting icon and select Descending
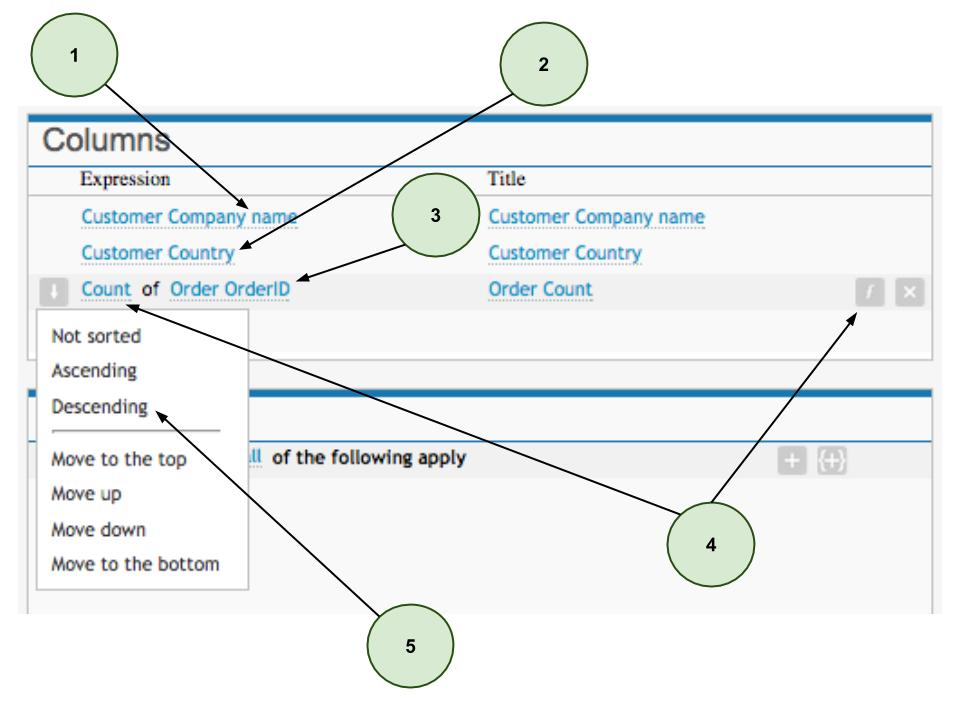
Results are displayed according to the number of orders made by every company, in the descending order.
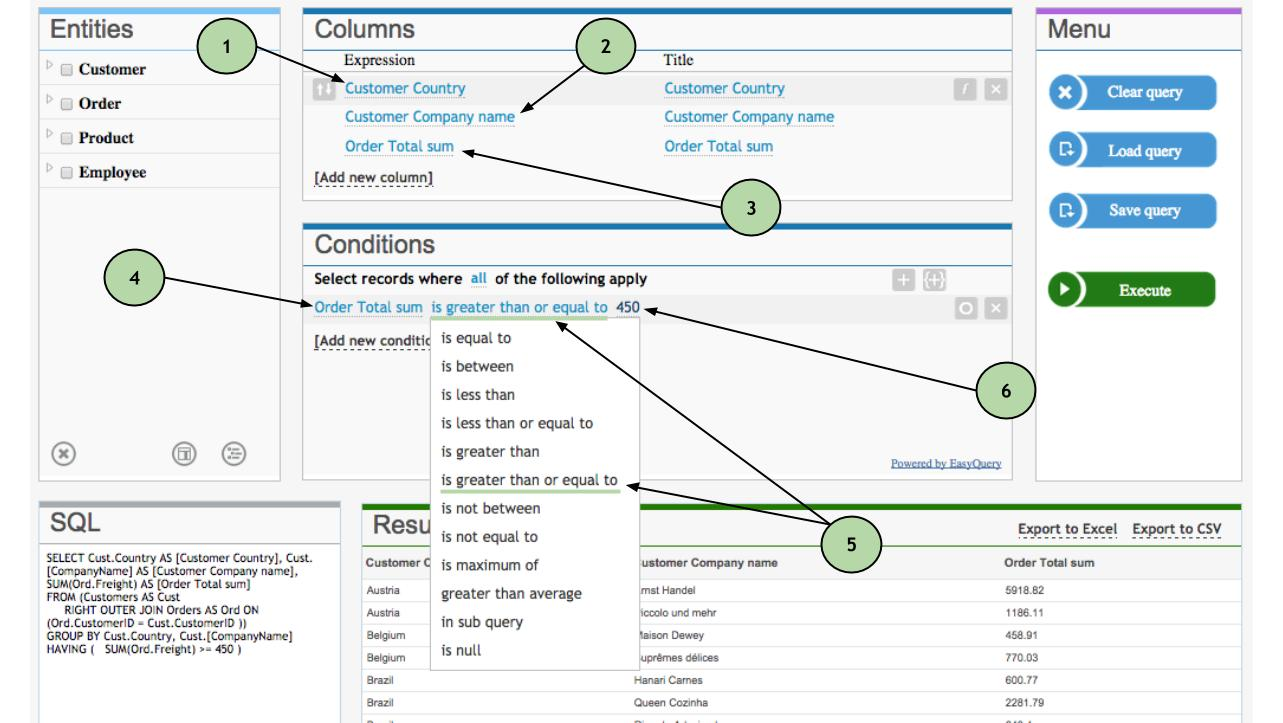
4) Filtering Data 1 (One Condition)
We often deal with situations when, for example, of all the customer companies, we must select only those who have purchased goods worth 450 or more. In cases like this, we should use the Conditions Panel for data sorting.
Let us do a sample query with the following data displayed: customer companies, countries of their origin, and total sum of their purchases. So, in the Columns Panel we select:
- Customer -> Country,
- Customer -> Name,
- Order -> Total sum.
Now we switch to the Conditions Panel and:
- add Order -> Total sum,
- change the operator 'is equal to' to 'is greater than or equal to,'
- and enter 450 in the value slot, as it is shown in the picture below.
It will look like this:
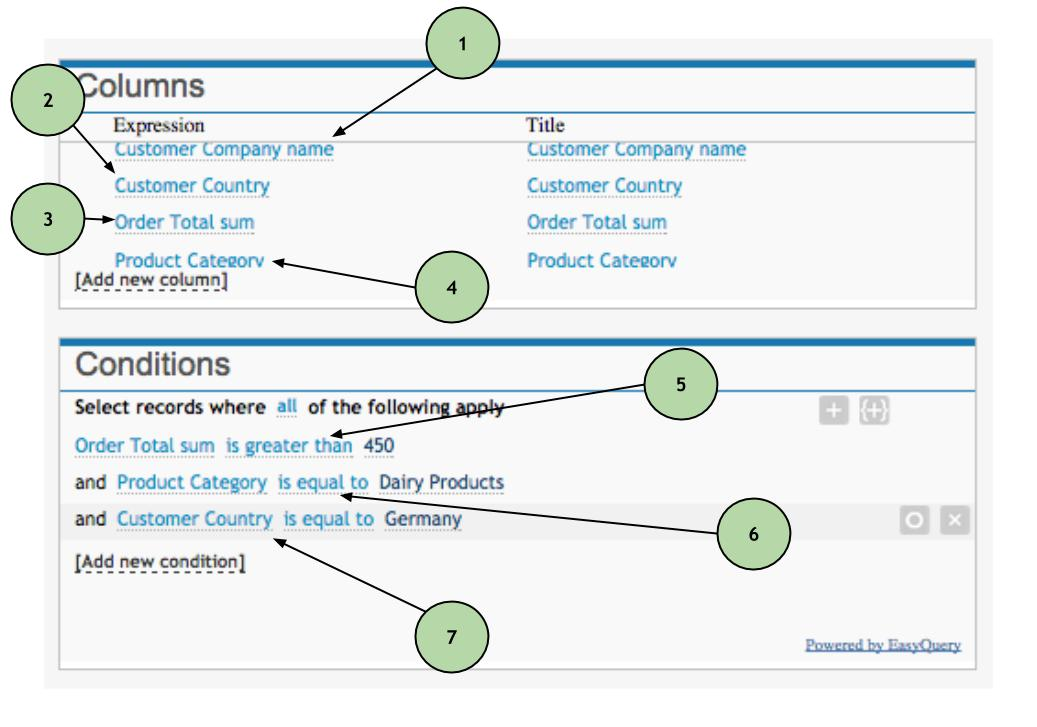
5) Filtering Data 2 (Several Conditions)
Often we have not one, but several conditions for filtering data. For example, we need a list containing information on:
- customer companies from Germany,
- whose purchases are worth more than 450,
- and those purchased products are in the 'Dairy products' category.
Firstly, we need to specify that, if (by default) every new condition is an additional limitation to the existing ones, they are connected by a conjunction 'and.' In this particular case, it absolutely suits us, but we will show you how to change this (when necessary) a little bit later.
Thus, when building a query, we indicate first which columns to display, through the Columns Panel:
- Customer -> Company name,
- Customer -> Country,
- Order -> Total sum,
- Product -> Category,
then we add the following to the Conditions Panel:
- Order Total sum -> "is greater than" -> 450
- and: Product Category -> "is equal to" -> Dairy products
- and: Customer Country -> "is equal to" -> Germany
See how it looks below:
6) Filtering Data 3 (Several Conditions with AND and OR Conjunctions)
Let us suppose that the query conditions in the example 5) have changed to the following:
We need a list of customer companies which:- purchased a total of $450 worth of products
- in the Diary category,
- and their postal code contains 4 or 5.
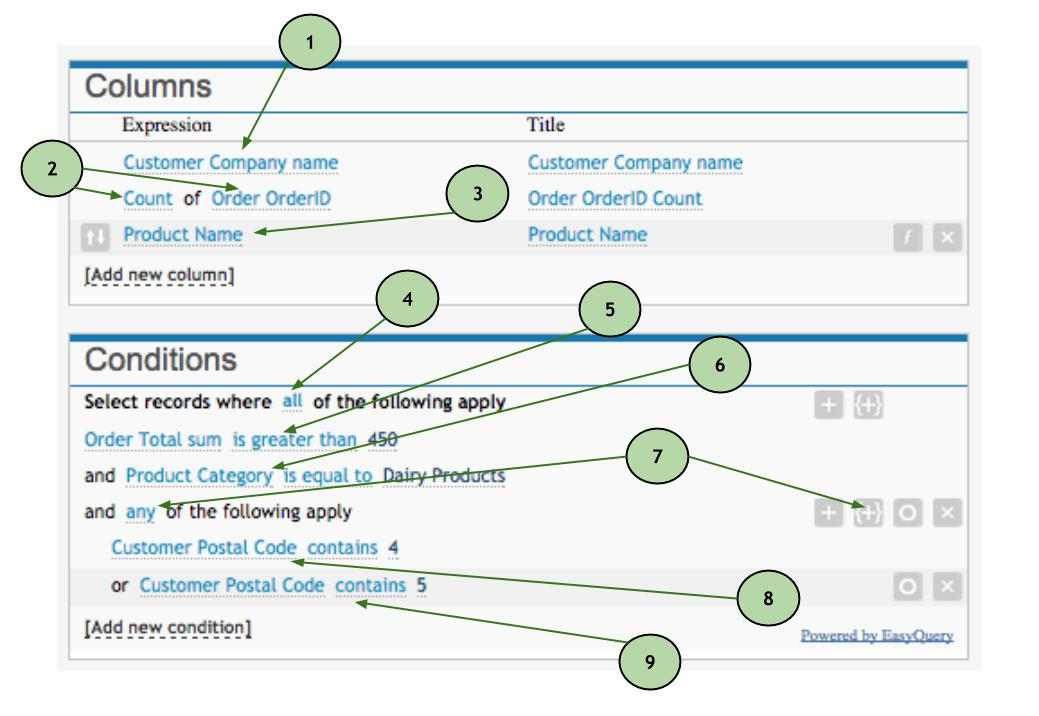
In the Columns Panel, we select:
- Customer -> Company name,
- Order -> OrderID (f = Count),
- Product -> Name
- We keep 'all' in the Conditions Panel's topmost line ("Select records where all of the following apply")
- Using a [+] button, we add a condition: Order -> Total sum -> "is greater than" -> 450
- and another condition: (and) Product -> Category -> "is equal to" -> Dairy Products
- Next to the first line at the top, we add a group of conditions with the help of a symbol {+} and leave 'any' in a newly formed line.
Consistently, after "and any of the following apply," we add two conditions, by clicking a [+] button:
- Customer -> Postal code -> "is equal to" -> 4
- (or) Customer -> Postal code -> "is equal to" -> 5
It will look this way:
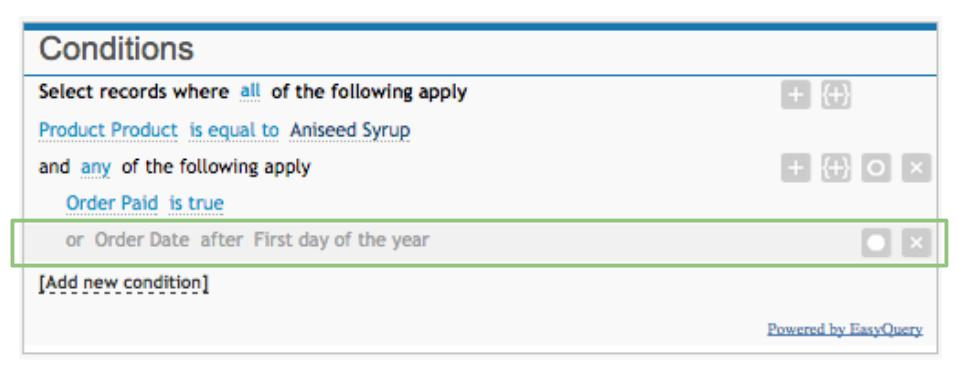
7) Enabling/Disabling of Conditions
Let us assume that we are interested in a particular product - Aniseed Syrup. All we need to know is the list of companies that either have paid for their order, or have made an order starting from the first day of the year.
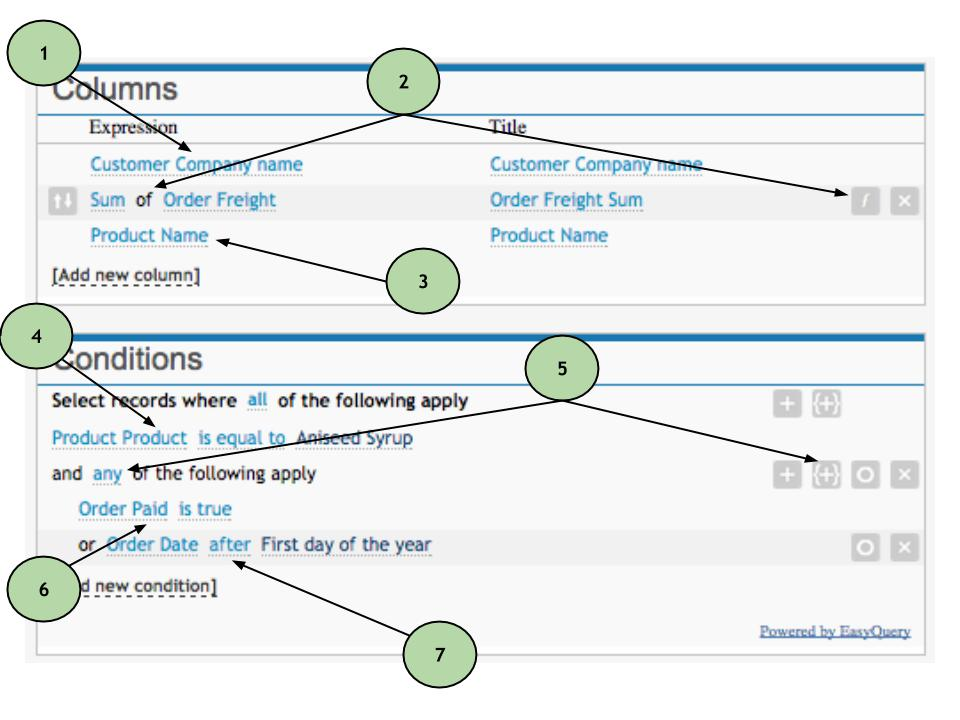
Therefore, we indicate the following in the Columns Panel:
- Customer -> Company name,
- Order -> Freight (f = Sum),
- Product Name (we will use it only to illustrate the example better).
In the Conditions Panel, we will take a set of steps:
- Product -> Product -> "is equal to" Aniseed Syrup
- We create a group of conditions by clicking {+} and using 'any' in "and any of the following apply"
- Order -> Paid -> "is true"
- (or) Order -> Date -> "after (special)" -> First day of the year
Below is the visual representation of our steps:
And the result we get:
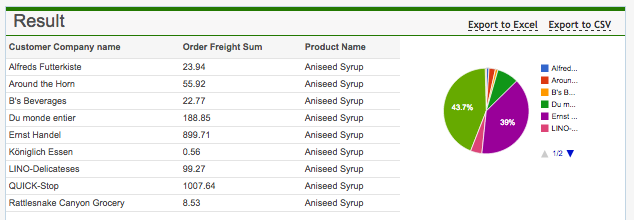
It can happen so that we will be needing only total sums of orders made after beginning of the year, or right the opposite - only orders which have been paid for (with no time restrictions).
There is an option of hiding particular conditions specifically for cases like this one. To the right of a condition itself, you will see a 'hide condition' button - [o]. By clicking on it, we get a broader range of data we want to be displayed: